 Sale!
Membership
Sale!
Membership
Insta-Grid Studio Resell Rights
Original price was: $107.09.$37.47Current price is: $37.47.
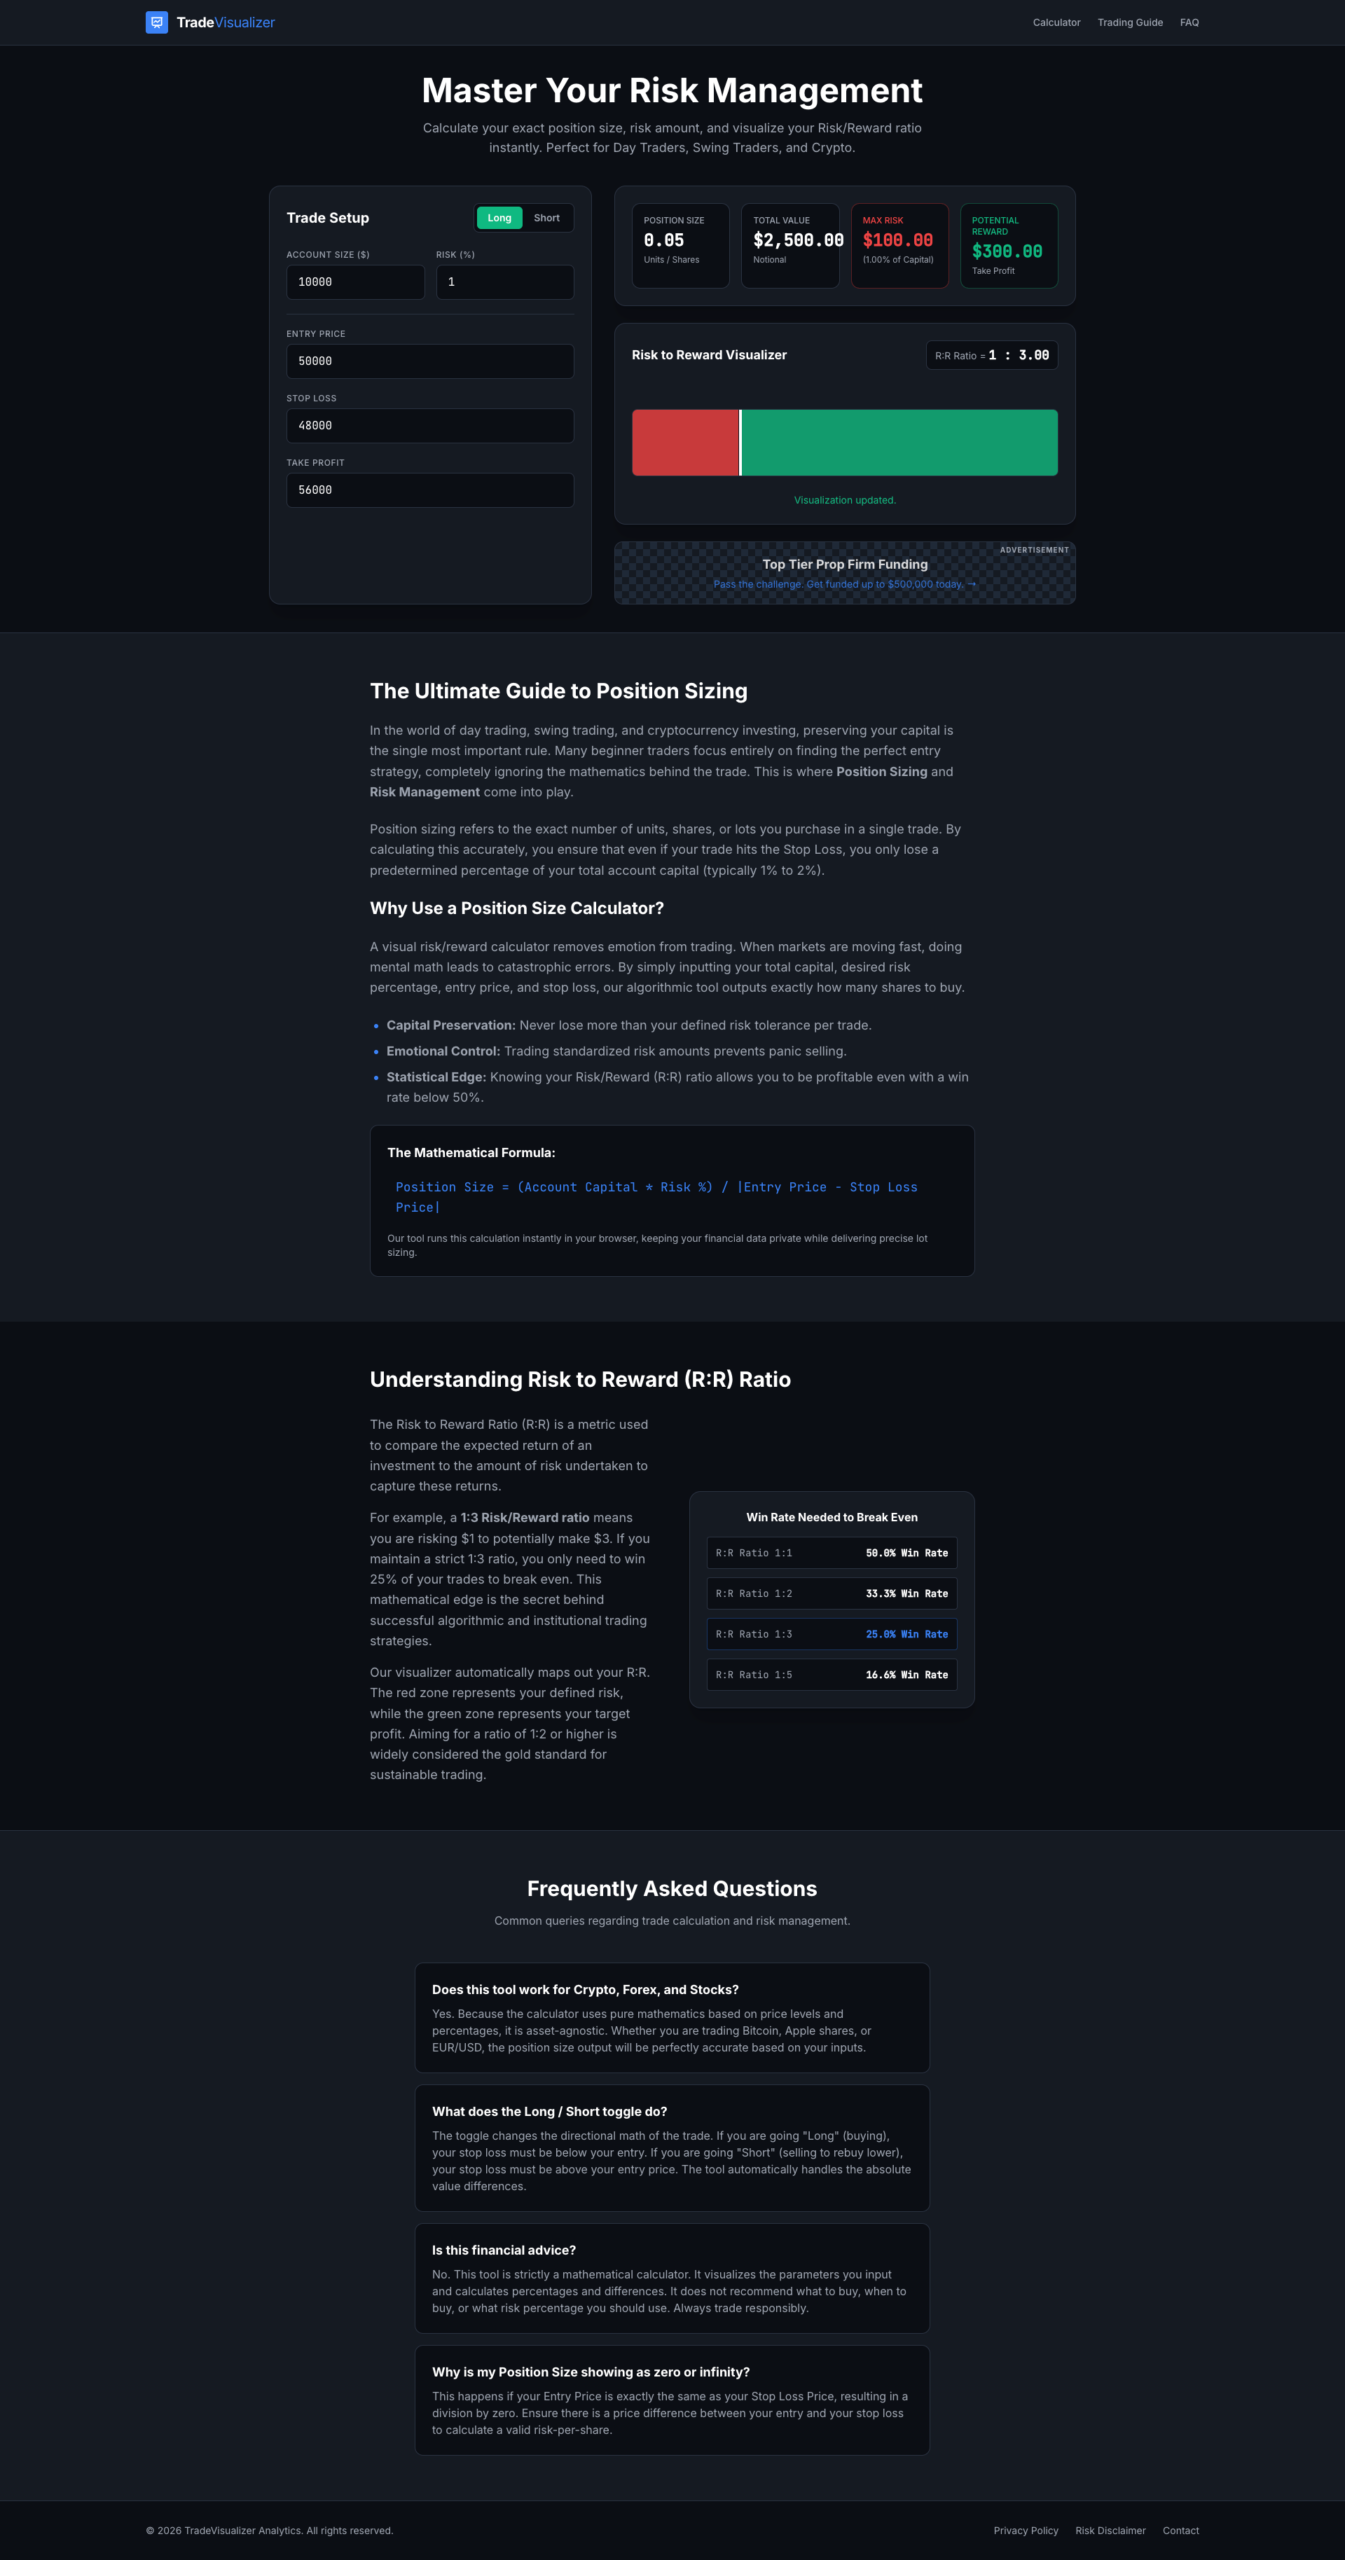


In professional trading, the ability to visualize risk before execution is what separates the consistently profitable from the rest. TradeVisualizer is a premium digital utility designed to provide traders with a clear, mathematical representation of their trade setups. By moving beyond static spreadsheets and mental math, this tool allows you to interactively engineer your trades on a sophisticated canvas, ensuring that every position you take is backed by sound risk-to-reward logic.
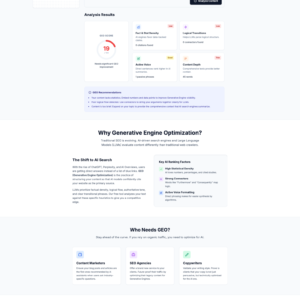
TradeVisualizer features a sleek, high-contrast interface optimized for rapid analysis. The core experience centers around a dynamic charting environment where you can:
Precision Plotting: Drag and drop your Entry Price, Stop Loss, and Take Profit levels directly on the visual matrix.
Real-Time R:R Calculation: Instantly see your Risk-to-Reward ratio update as you move your targets. Whether you are hunting for a 1:2 or a 1:5 setup, the math is handled for you in real-time.
Position Sizing Logic: Input your account balance and risk percentage (e.g., 1% or 2%) to receive an automated calculation of the exact position size required to maintain your risk parameters.
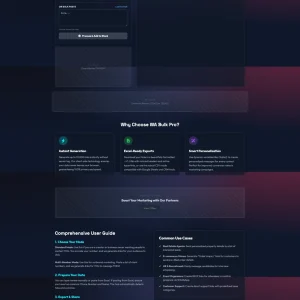
TradeVisualizer is more than just a calculator; it is a comprehensive workspace for mastering market mechanics. The platform includes integrated resources to help you understand:
The Power of R:R: Learn why a high risk-to-reward ratio allows for long-term profitability even with a lower win rate.
Price Action Fundamentals: Utilize the visualizer to identify key technical levels, including support/resistance zones and liquidity sweeps.
Isolated vs. Cross Margin: Gain insights into how different margin types impact your liquidation price and overall portfolio safety.
To further sharpen your edge, TradeVisualizer provides a sidebar of essential quantitative tools:
Kelly Criterion Sizer: Determine the optimal percentage of your capital to risk based on your historical edge.
Volatility Estimator: Gauge market “noise” to set more intelligent stop-loss levels.
Risk/Reward Matrix: Compare multiple hypothetical scenarios to find the most efficient path to your profit targets.
Designed for the modern desk, TradeVisualizer utilizes a “Liquid Glass” aesthetic that prioritizes data readability and aesthetic appeal. The dark-mode interface reduces eye strain during long sessions, while the responsive design ensures your analysis remains sharp on any device. With zero external dependencies, the engine runs natively in your browser for maximum speed and data privacy.
Stop trading blindly and start engineering your success with surgical precision. Click the “Live Preview” button to interact with the working demo and visualize your next winning trade before it happens.
Sale!
Membership
 Sale!
Membership
Sale!
Membership
 Sale!
GeneratePress Template
Sale!
GeneratePress Template
 Sale!
Membership
Sale!
Membership
Reviews
There are no reviews yet.