Professional Backtesting, Reimagined Through Precision UI
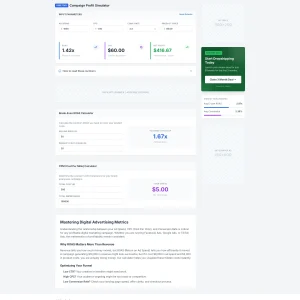
The Institutional-Grade Backtest Evaluation Dashboard presents a refined, high-performance interface built for analyzing trading strategies with clarity and structure. Designed with a modern dark aesthetic and clean data hierarchy, this tool focuses on transforming raw trade inputs into meaningful performance insights—without visual clutter or unnecessary complexity.
At its core, the interface emphasizes usability and analytical depth. From the moment you land on the dashboard, the layout guides you through a logical workflow: input your trading data, run analysis, and instantly interpret key performance indicators.
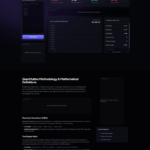
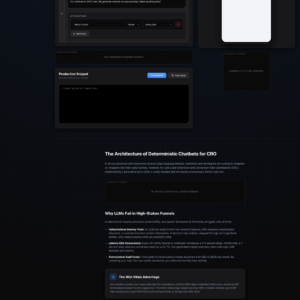
Structured Data Input for Seamless Analysis
The left-side data ingestion panel is purposefully minimal yet functional. It allows users to define:
- Initial capital
- Risk-free rate
- Raw trade series input
This streamlined approach ensures that users can quickly feed their data into the system without friction. The inclusion of a clear “Run Analysis” call-to-action enhances usability and keeps the workflow intuitive.
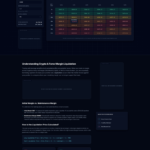
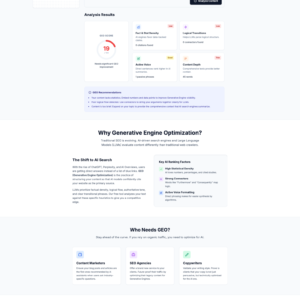
Comprehensive Performance Metrics at a Glance
The central dashboard showcases a grid of core performance indicators, each presented in clearly defined cards for quick scanning:
- Net Profit
- Win Rate
- Profit Factor
- Expectancy
- Maximum Drawdown
- Sharpe Ratio
- Average Win & Loss
Each metric is visually separated and easy to interpret, making it ideal for both quick overviews and deeper analysis sessions. The design prioritizes clarity, ensuring that even complex financial data remains accessible.
Visual Equity Tracking & Analytical Depth
A dedicated equity curve section provides a graphical representation of portfolio progression over time. This visual layer adds context to numerical data, helping users understand performance trends and drawdowns more effectively.
Complementing this is an advanced analytics panel highlighting:
- Gross profit and loss
- Payoff ratio
- Consecutive wins/losses
- Return on initial capital
These elements are organized in a compact yet readable format, maintaining consistency with the overall interface design.
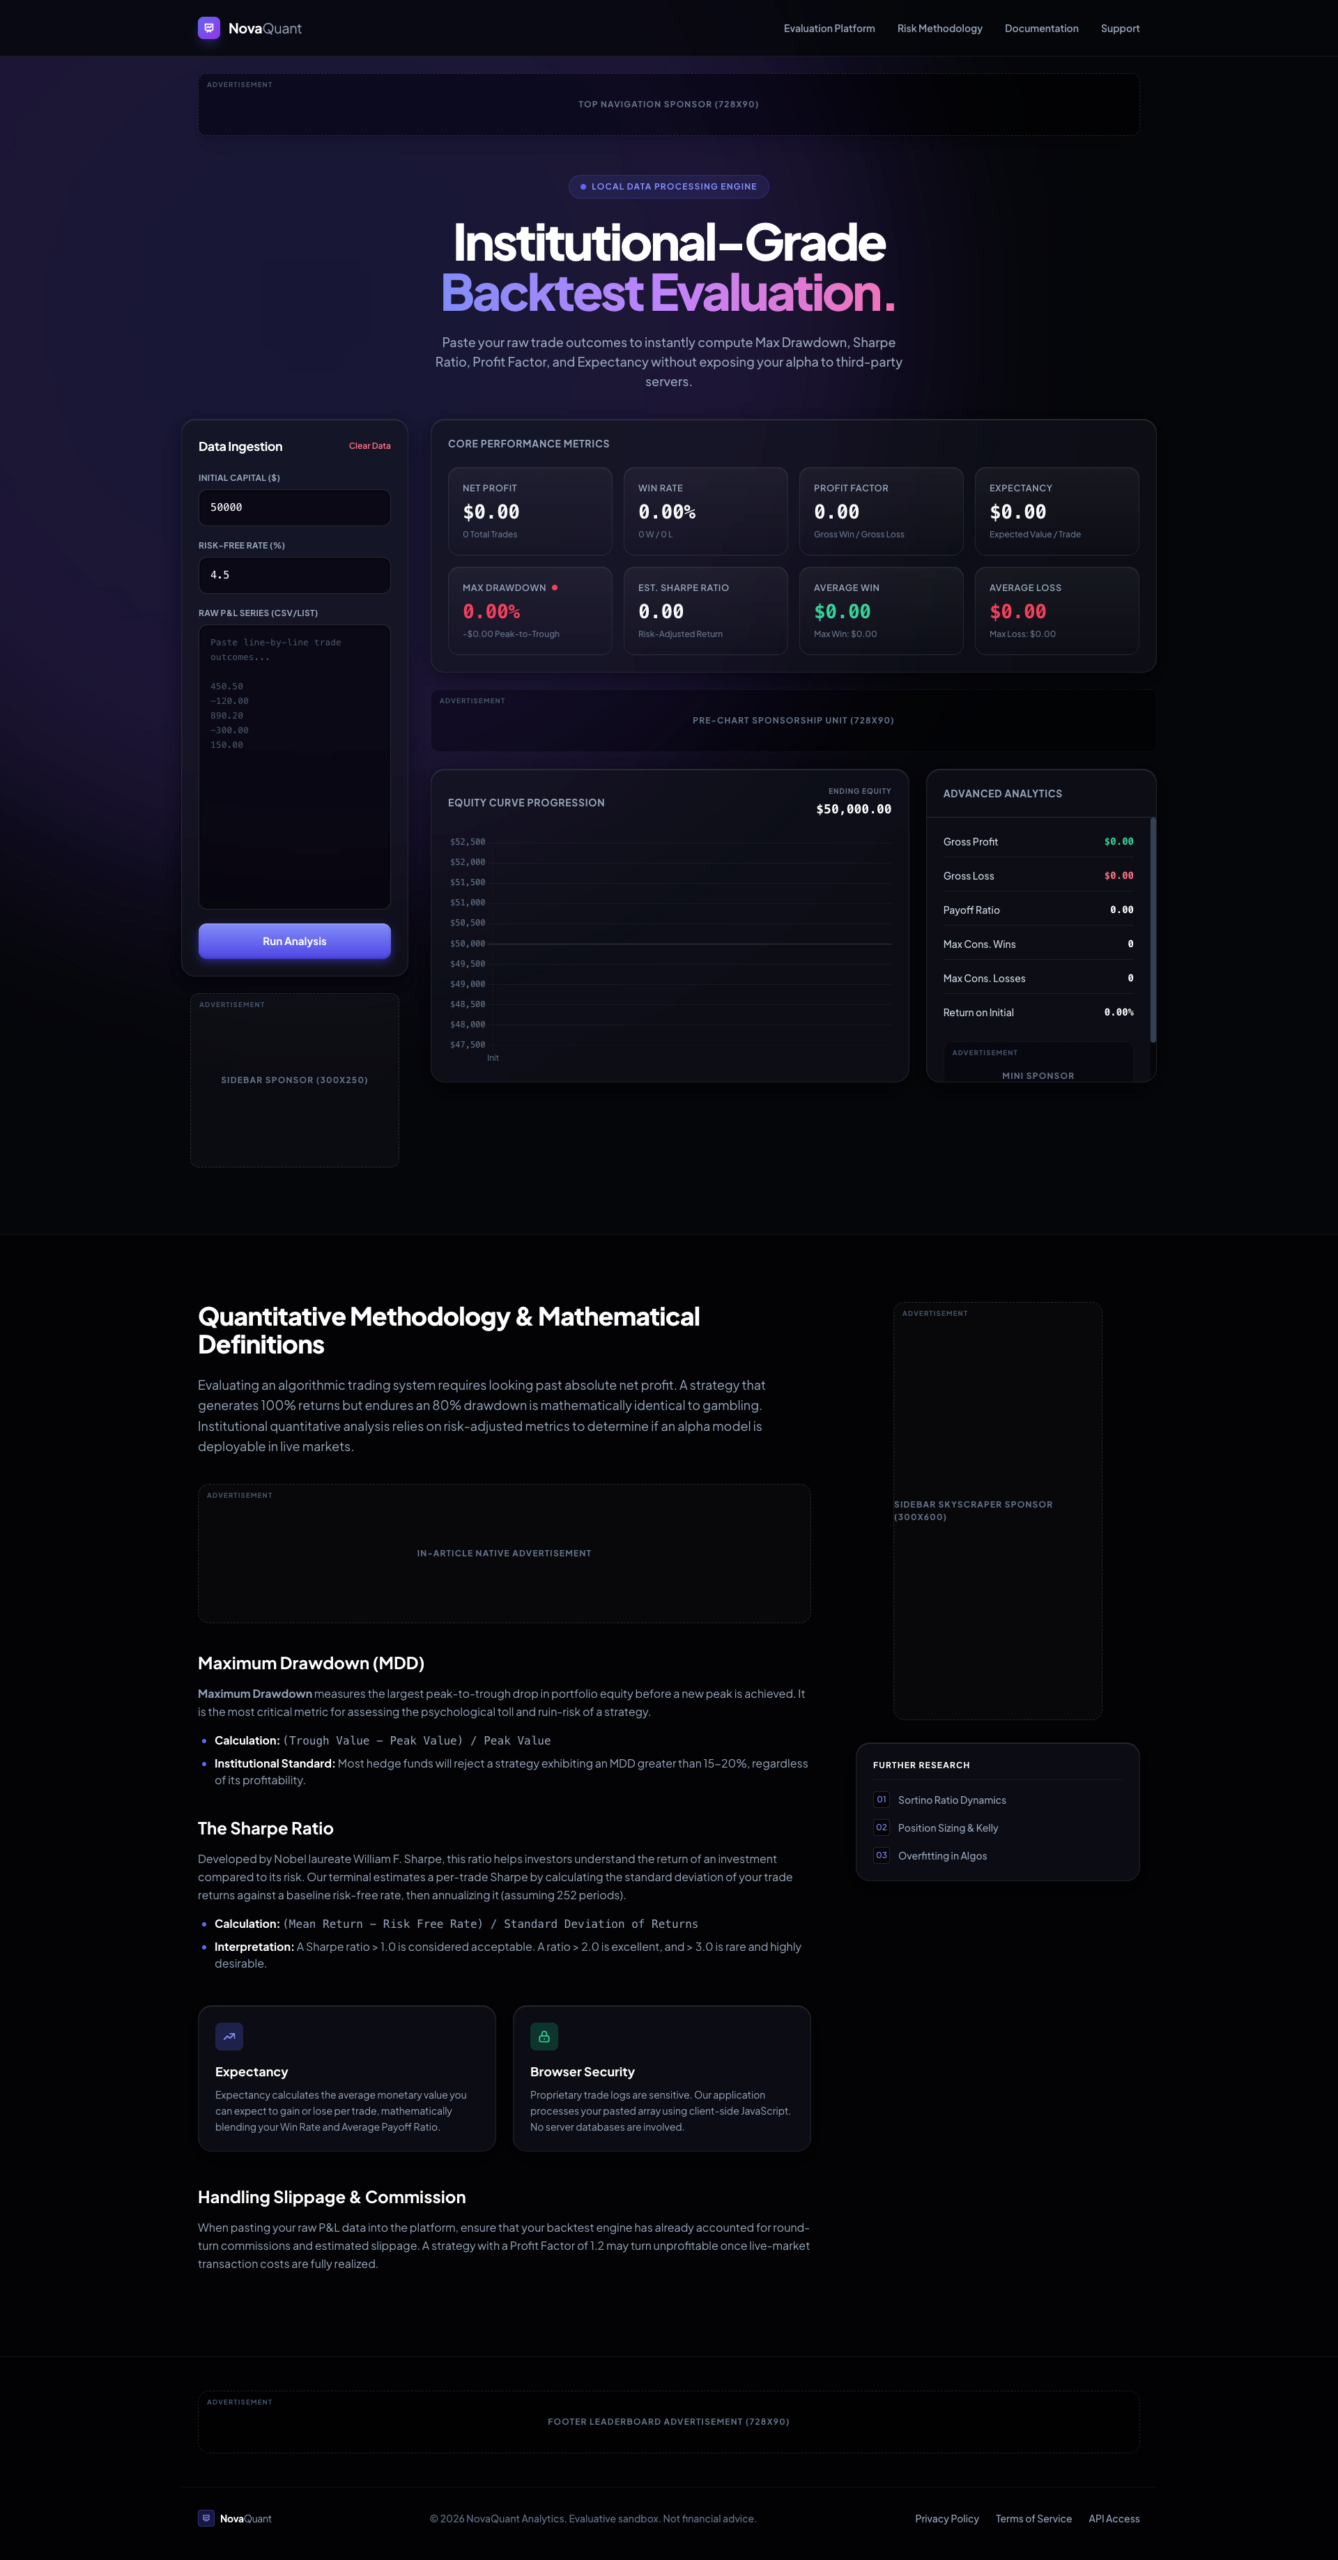
Educational Insight Built Into the Experience
Beyond raw analytics, the interface includes a structured knowledge section covering key quantitative concepts such as:
- Maximum Drawdown (MDD)
- Sharpe Ratio
- Expectancy
This adds an educational layer to the product, making it not just a tool—but a guided analytical environment.
Clean, Modern, and Purpose-Driven Design
The visual design stands out with:
- A premium dark gradient theme
- Soft-glow accents for emphasis
- Well-balanced spacing and typography
- Card-based modular layout for clarity
Every element feels intentional—built to reduce cognitive load while maximizing insight.
Why This Interface Stands Out
- Clear separation between input, analysis, and insights
- Strong visual hierarchy for fast data interpretation
- Balanced combination of numerical and graphical outputs
- Built-in educational context for better understanding metrics
- Smooth, distraction-free user experience
Experience It Live
This dashboard is best appreciated in action. Click the Live Preview button to explore the real interface, interact with the data flow, and experience the full analytical environment before making your decision.
 Sale!
Membership
Sale!
Membership
 Sale!
AI Chatbot
Sale!
AI Chatbot
 Sale!
GeneratePress Template
Sale!
GeneratePress Template
 Sale!
biobonus
Sale!
biobonus
Reviews
There are no reviews yet.